


Applications
We can conduct surveys and provide services which can support a range of research, infrastructure and resource development projects.
Services
We provide Bathymetry/hydrography, Oceanography/hydrology. geophysical/geotechnical, concrete inspection, and land survey services.
Equipment
We have positioning systems, topographic systems, hydrographic systems and much more depending on your needs.
RANGE OF SERVICES
- Bathymetry and Hydrography
- Oceanography / Hydrology
- Geophysical / Geotechnical
- Concrete Ispection
- Land Survey
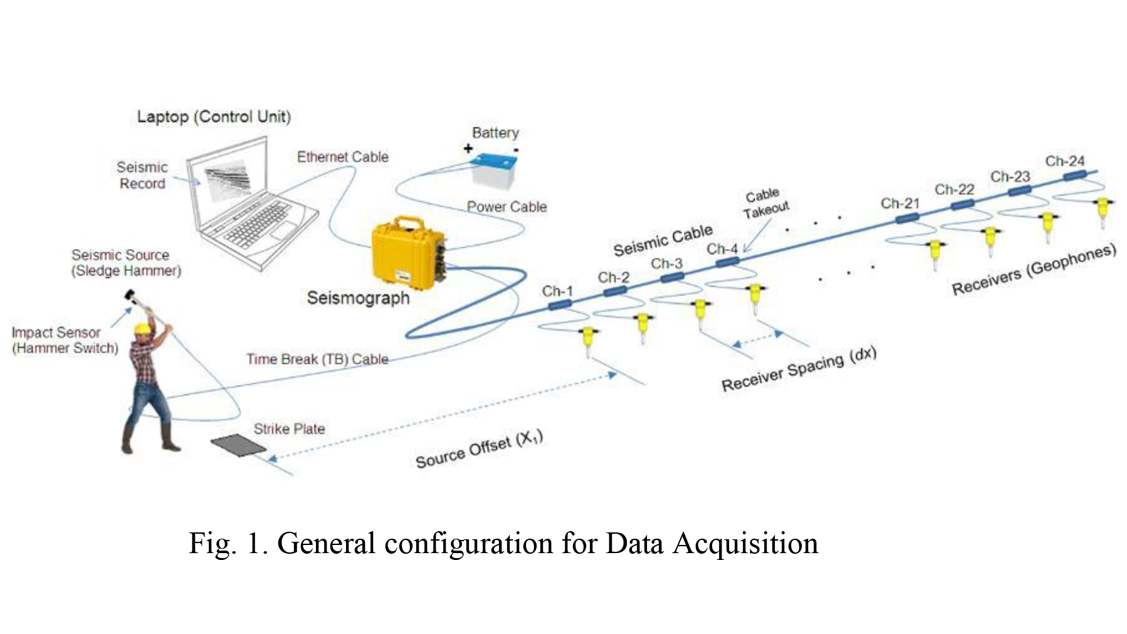
SEISMIC SOLUTIONS
Trinav Surveys can now offer Seismic Acquisition and Processing services in the Philippines. With a 24 channel seismograph, Geophones and Processing capabilities we can perform Seismic Refraction, Tomography and MASW (Multichannel Analysis of Surface Waves) studies.
Typical applications include:
- Foundation engineering studies
- Vs-30 site classification
- Depth to bedrock
- Depth to ground water
- Shallow voids and faults
- Estimating rippability prior to excavation
The system is “man portable” and can be used in remote areas with no road access.
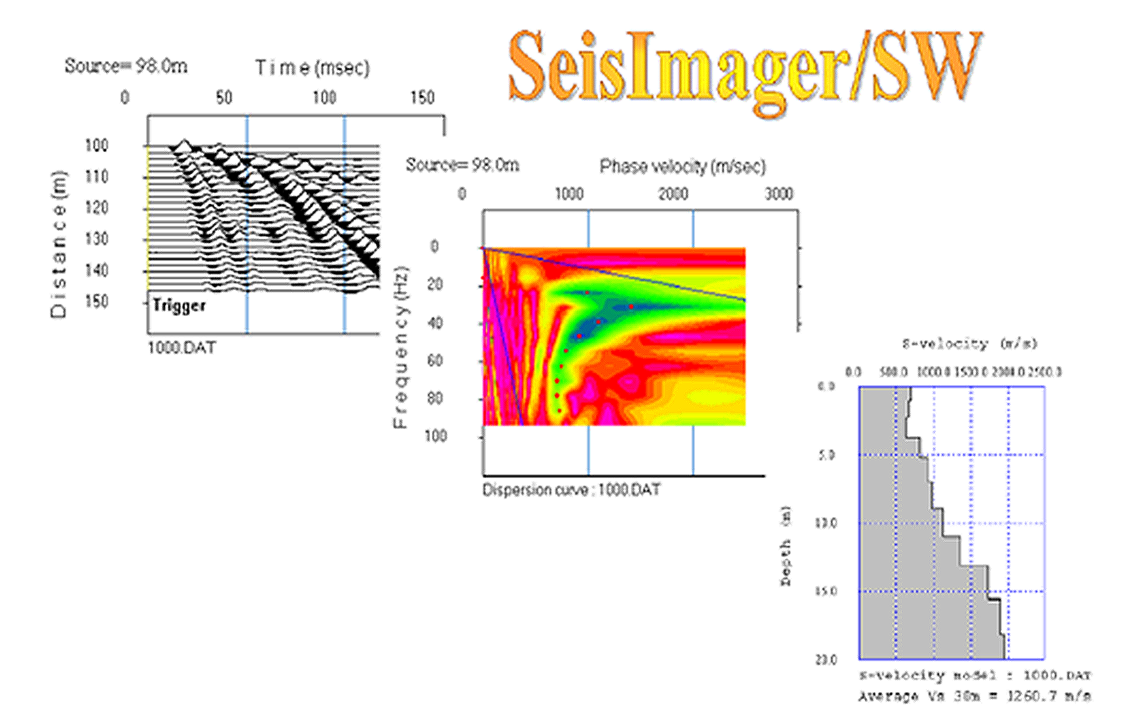
Surface Wave Data Analysis
Use of 4.5 Hz geophone and a longer record length of 1 to 2 s world have provided more surface wave data, but sill some information can be gleaned from this refraction record. Not surprisingly, the calculated Vs30 is about one-half of the second layer Vp determined through refraction.
MASW - Applcations
Shear-wave velocity (Vs) information of subsurface materials is directly related to the stiffness property of the materials, which is the key property dealt in all geotechnical engineering projects. In this sense, the MASW method can be applied to any geotechnical engineering project that requires subsurface mapping of the stiffness in 1-D, 2-D, and 3-D formats.
The most common type of application has been the soil-bedrock mapping that delineates topographic boundary between soil and bedrock by an interface of significant velocity (Vs) increase (e.g., from 300 m/sec to 1000 m/sec). It also shows vertical and horizontal variation of soil stiffness by displaying velocity (Vs) variations within the soil range (e.g., 100 m/sec - 300 m/sec). This boundary often shows a gradual change in velocity over a certain depth range rather than a sharply-defined interface, indicating the possible weathered zone on top of the bedrock. More recently, applications to detect subsurface anomalies are merging. These anomalies may include localized low-velocity zones created by various reasons such as existing utility tunnels, void development due to collapse, severely weathered bedrock, loss of cohesiveness in filled materials, etc. In this case, the detection is often facilitated by non-velocity mapping approaches such as back-scattering analysis and common-offset section generation. Another type of application is the performance evaluation that is executed before and after a specific operation is applied. This includes the compaction evaluation for surface and shallow subsurface materials during road and building construction.
Site classification according to EC8 and DIN4149
In order to quantify the design load for buildings due to an earthquake the Eurocode 8 (EC8) and the DIN4149 require the classification of the ground. The dominating or average shear wave velocity in depths down to 30 m is most often used for this classification. Beyond that the standards request certain design features as flexible foundation beams based on the class of the subsoil which are affecting the costs of a building. A seismic survey can often reduce the costs because otherwise necessary safe assumptions concerning the classification are avoided. Surface wave measurements such as MASW are especially suited to determine shear wave velocity profiles at these shallow depths.
Example:
MASW measurements were made in the planning phase of a warehouse to classify the building site and to determine the necessity of flexible foundation beams. The result in the figure to the left shows the calculated shear wave velocity profile, where the velocity depth profile is assigned to the middle of the geophone array. The average shear wave velocities determined at depths of 3 to 20 m is the so called dominating shear wave velocity. This velocity is used to classify the foundation site according to DIN 4149. For this example the site was assigned as subsoil class B with dominating shear wave velocities between 350 and 800 m/s. For class B foundation sites, situated in low risk earthquake zones, the use of flexible foundation beams is not required.

Depth to bedrock
Seismic refraction is well suited for delineating material properties of the subsurface, such as seismic velocities. The obtained seismic velocities indicate the depth to bedrock and the associated bedrock topography variations.
Example:
A seismic refraction survey was conducted at a planned flood control basin. The depth to bedrock and the bedrock topography were delineated to determine the required anchoring depth of the basin. The results enabled a subsurface characterization into three layers of different material properties, based on geological and weathering interfaces.
MAGNETICS
The measurement of the Earth’s Magnetic field is an important Geophysical discipline that has wide applications in various fields
- Mineral exploration
- Mining ore body delineation
- Buried pipelines and other utilities
- Archeological studies
- Un-eXploded Ordnance (UXO)
- Marine ship wrecks
- Marine anchors, chains and other items
- Marine cables, pipelines, etc.
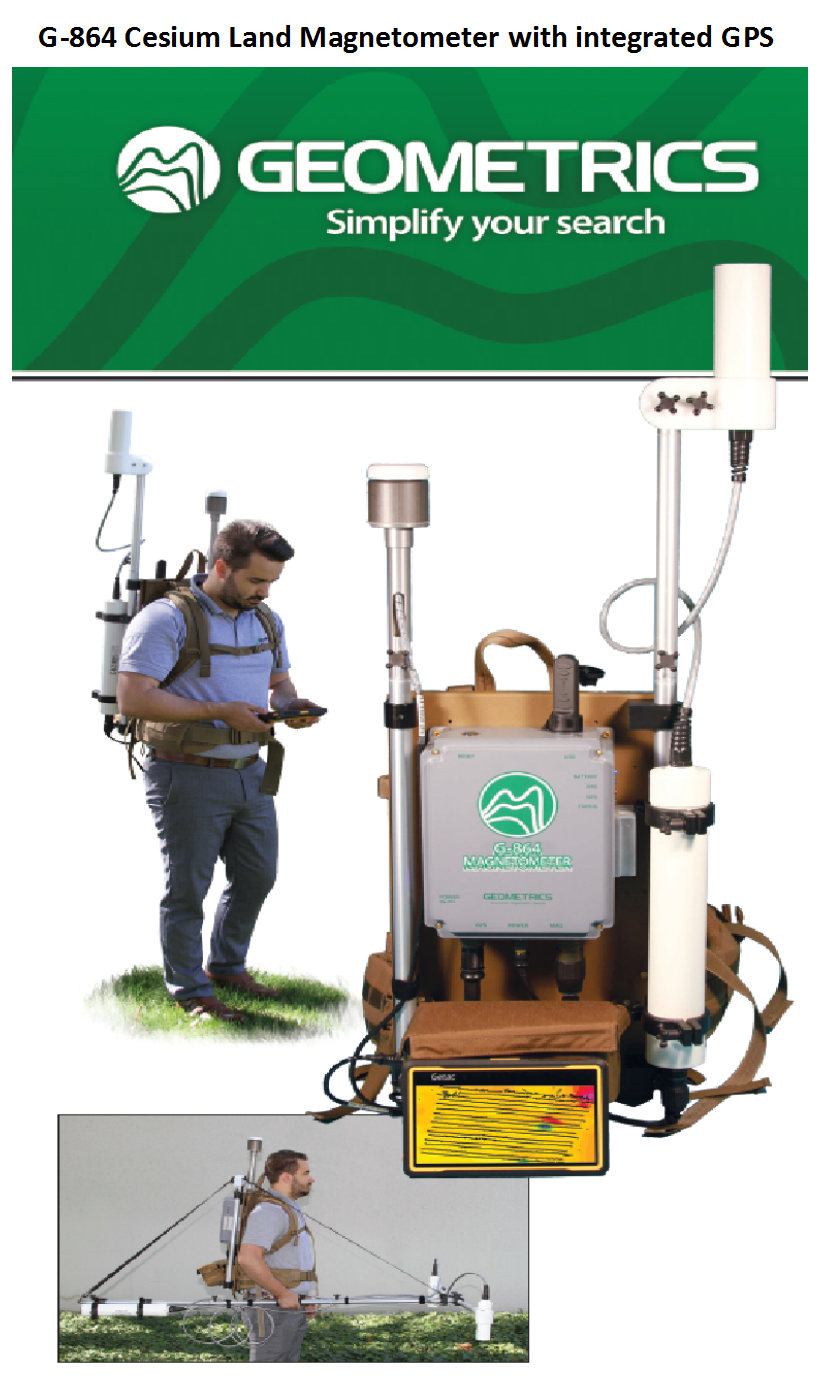
Trinav has available Land and Marine Cesium Vapor Magnetometers for Field data acquisition and Proton Precession units for Base Station measurements to allow correction of the data during processing for Diurnal fluctuations.
The Earth’s Magnetic Field in the Philippines is approximately 39,500 nanoTesla with inclination of 0 degrees in the South to 42,500 nanoTesla with inclination of 26 degrees in the North
The Cesium Sensors have a sensitivity of 0.1 nanoTesla and detect small ferrous objects (i.e. UXO) or larger regional trends (mineral exploration)


G-859. A self contained, “Back Pack” configuration that can collect high quality magnetic data at “walking speed”. The integrated GPS enables data collection without the necessity to set-out grid lines prior to the survey

GROUND PENETRATING RADAR
SIR-3000 SYSTEM
TRINAV can now offer an important tool for the non-destructive and non-intrusive mapping and surveying of underground featrures.
The surface intercae radar (S.I.R.), is a ground penetrating radar system that has wide apllications in the inspection, construction and civil engineering fields.
SUB SURFACE MAPPING

A New – Non Destructive Method Of Surveying
WITH OUR GROUND PENETRATING RADAR (G.P.R.) SYSTEMS WE CAN PROVIDE INSPECTION, LOCATION AND MAPPING OF SUB SURFACE FEATURES.
THESE CAN INCLUDE:
- • CONCRETE THICKNESS
- • SUB-BASE THICKNESS
- • EROSION AREAS AND VOIDS
- • GEOLOGICAL MAPPING
- • WATER TABLE MAPPING
- • RE-BAR LOCATION
- • BURIED UTILITIES (PIPELINES, CABLES. CONDUITS, TUNNELS)

MODEL MLF ANTENNAE SYSTEM

Void/Cavite detection at Mactan Island
MODEL 5103 400 MHz. ANTENNAE SYSTEM
Burned utility survey prior to trenching for cable burial
SURVEY CART WITH 400/900 MHz. ANTENNAE SYSTEM
 >
>
Radan 7
The world's most advanced and easy-to-use Ground Penetrating Radar data processing and analysis package New Map Mode with GPS data integration.
3D QuickDraw Module
- ● Multiple interactive views of pipes and other targets picked by the user
- ● Automatic Target and Pipe Recognition Results generated quickly and automatically into the Interactive-3D window
- ● Edit targets or pipes (size, color, material)
- ● Link and unlink picks to form pipes and targets
- ● Ability to add and delete pipes and targets
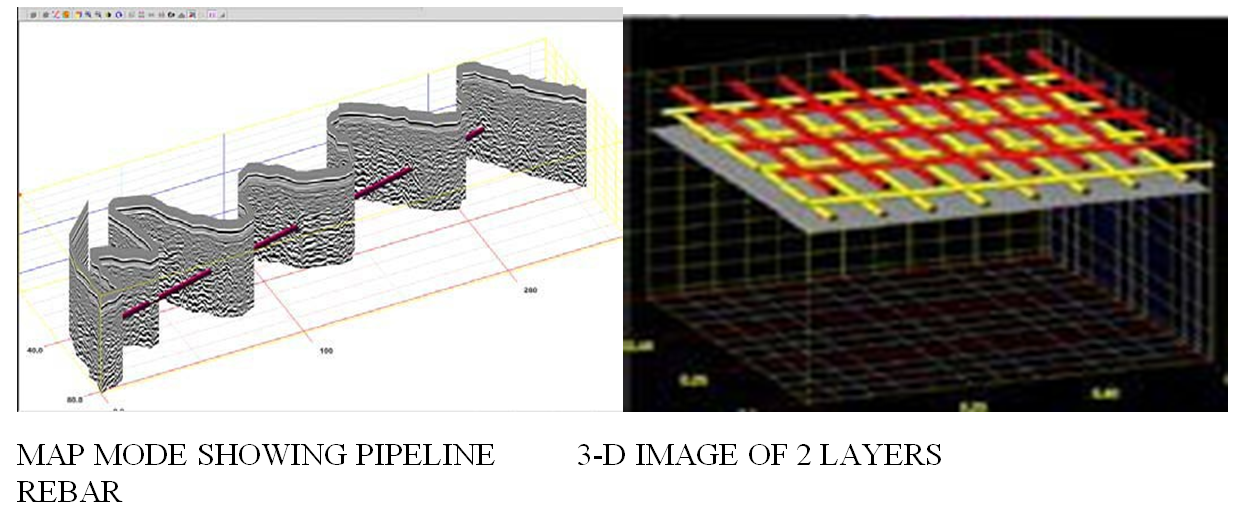
MAP Mode
New mode allows 2D files collected with GPS data to be viewed in 3D. See the actual spatial view of collected data.
Enhanced and Simplified 3D Viewing
QuickDraw module provides improved 3D viewing options in a single dialog box. Animation from any slice with any other slice. Z width control always available. Stretch, shrink and zoom as desired. Fit a large file into a single view or zoom in on any section.